Seeing RED

summary
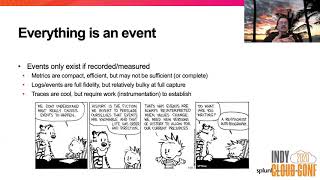
RED claims that monitoring focused on RED (Rates, Errors, Duration) plus logs and traces finds root causes faster; it recommends Prometheus/APM metrics, service mesh (Istio, Envoy, Linkerd) for low-friction distributed tracing, and OpenTracing/OpenCensus/OpenTelemetry for telemetry. Expect each microservice request to produce tens to hundreds of spans, occasional queues of 160 items to cascade latency, and concrete business numbers — 5s loses sales, 3.2 seconds = 68% abandon — so the talk shows what to measure, what tools to use, and why it works.
AI-written summary · about
chapters (6)
- 0:00Start
- 1:21Observer Ability
- 16:38Distributed Trace Model
- 23:22Metrics Model
- 25:22Distributed Tracing
- 26:38Top Strategy for Reading Out the Red Herrings
related talks
 39mSeeing RED: Monitoring for Microservices and Serverless
 35mThe RED Method: How To Instrument Your Services [B]
 35mMonitoring Microservices
 38mThe Murphy's Laws of Observability
 53m.NET Rocks Live
 22mDistributed Tracing
 47mResolving performance issues in practice
 34mReduce Complexity with Distributing Tracing