LTTNG-UST Efficient System Wide User-Space Tracing
summary
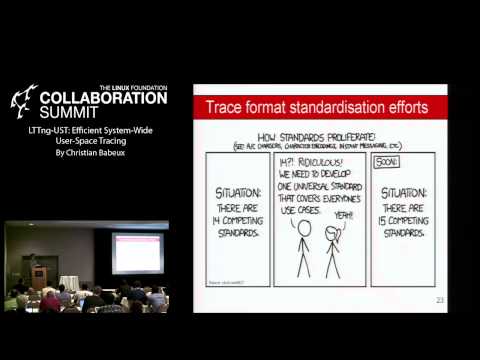
LTTng-UST implements an in-process tracer using a user-space ring buffer (kernel ring buffer ported to user space) with liblttng-ust linked into apps, a session daemon and consumer/relay daemons for disk and TCP streaming, and supports LTTng tracepoints, SystemTap SDT providers and partial uprobes integration. Benchmarks report 200 ns per event overhead, traces survive process crashes via shared memory, filters use a C-like syntax, and output conforms to the CTF common trace format.
AI-written summary · about
chapters (31)
- 0:00Introduction
- 0:40Christian
- 0:59Agenda
- 2:28Unified User Interface
- 3:27Overview
- 3:41LTTNG Modules
- 4:22System Utilities
- 5:13Viewers
- 6:05Eclipse Plugin
- 7:19UserSpace Tracer Instrumentation
- 8:26How does it work
- 9:11Setting up a tracing session
- 9:45Starting a tracing session
- 11:57Tracing points
- 12:56Invoke trace point
- 13:21Statically defined providers
- 14:02Probes
- 15:20XKCD Comic
- 15:32Open Tracing Format
- 17:20Java Tracing Tool
- 18:46Issues
- 19:44Thread Local Storage Variable
- 20:59The Issue
- 21:56Recent Features
- 22:51Network Streaming
- 23:34Filtering
- 24:13Release Candidate Features
- 25:12Flight Recorder Mode
- 26:16Backend
- 27:10Conclusion
- 27:23Questions
related talks
 37mKernel and userspace tracing with LTTng and friends
 38mLTTng: Beyond Ring-Buffer Based Tracing
 48mEfficient and Large-scale Infrastructure Monitoring With Tracing
 26mLTTng for full stack tracing
 52mTracking Down What Happened: A Comparison of Tracing Solutions
 27mBeyond OTLP: Unlocking the Potential of OS-native Tracing
 12mStriaTrace: Efficient Tracing and Diagnosis for Online LLM Inference
 32mProcessor tracing in perf