Kernel and userspace tracing with LTTng and friends
summary
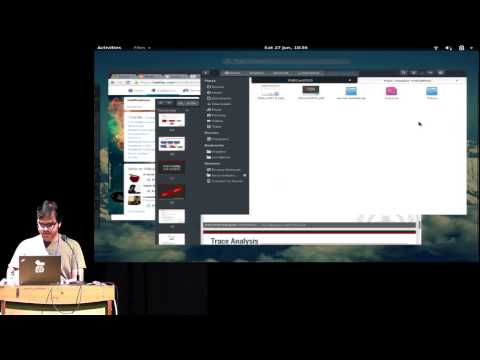
LTTng claims low overhead and real scalability, with a kernel tracer plus LTTng UST for userland, a session daemon that wires probes into shared‑memory ring buffers, and a consumer/relay model that supports live viewing. It stores traces in CTF parsed by BabelTrace, offers flight‑recorder snapshots and remote relay, and pairs with Trace Compass for critical‑path visualization. SystemTap and kprobes provide dynamic probes but trade scalability for flexibility, while GDB can do surprisingly fast local trace collections.
AI-written summary · about
chapters (21)
- 0:00Introduction
- 1:24Tracing 101
- 5:24Trace payload
- 6:22What is a tracer
- 7:27Types of tracers
- 9:02Trace macro
- 10:14Define trace points
- 11:04Other tools
- 11:37FTrace
- 15:56GDB
- 17:14LTTng
- 18:31Inside LTTng
- 19:36Userspace tracing
- 20:23Snapshots
- 20:39Live analysis
- 21:26Live trace view
- 22:22CTF viewer
- 22:48Critical flow view
- 30:27Life trace view
- 32:04System performance tools
- 32:54References
related talks
 36mLTTNG-UST Efficient System Wide User-Space Tracing
 38mLTTng: Beyond Ring-Buffer Based Tracing
 48mEfficient and Large-scale Infrastructure Monitoring With Tracing
 55mRecent Advances in Linux Tracing
 26mLTTng for full stack tracing
 52mTracking Down What Happened: A Comparison of Tracing Solutions
 35mLinux Tracing updates
 27mLow-Overhead Tracing Using eBPF for Observability into Kubernetes Apps and Services