Performance analysis using Systrace

summary
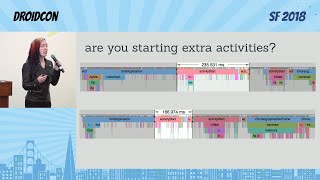
Systrace is used to collect CPU time slices and reveals concrete fixes: three trampoline activities add about 160 ms to startup, inflating a drawer view costs ~42 ms, and a lock labeled as monitor contention (from Realm) accounts for ~30 ms. Tracing also shows background threads doing blocking I/O that overlap UI work and sum to 107 ms of wait time. Traces come from running the systrace tool from the catapult repo and viewing the generated HTML to pinpoint and quantify each opportunity.
AI-written summary · about
chapters (5)
related talks
 42mDebugging Application Performance
 37mSystrace for games
 42mHow Much Is Tracing? Measuring the Overhead Caused by the Tracing Infrastructure
 54mUnderstanding Performance w/DTrace (While The Customer Yells)...
 48mCyclictest latency, find out why with tracing
 11mFinding out what's really going on, with DTrace!
 12mStriaTrace: Efficient Tracing and Diagnosis for Online LLM Inference
 52mTracking Down What Happened: A Comparison of Tracing Solutions