Risk Based Code Coverage Analysis
summary
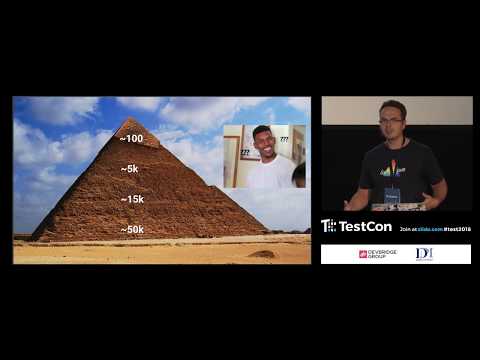
Combines clover reports with JIRA commit and bug-history to score lines by risk = probability × severity and map requests to code, stores everything in a database of coverage+bug points, and uses that to prioritize tests; half a million LOC yields ~100k uncovered lines but only a handful matter — about 10 high-risk methods with zero coverage, ~50 risky methods lacking integration tests and ~200 missing integration coverage; proposes selective test execution instead of chasing a single coverage percent.
AI-written summary · about
chapters (9)
- 0:00Start
- 5:40Percentage of Code Coverage
- 15:40Classification of Bugs
- 16:20Commit Frequency
- 18:37Severity
- 26:25Statistics and Mathematics
- 28:43Test Coverage Efficiency Metric
- 31:36Do You Cover the Most Risky Parts of Your Application
- 34:41Analyze Impact of Your Tests
related talks
 52mTest Impact Analysis. Smarten up your pipeline and reduce t
 53mReady to Run the Risk? - Applying a Risk-Based Approach to Testing
 07mHow code coverage can be used and abused to guide testing.
 26mImproving Coverage Analysis
 03mTest coverage
 34m"Escaping The Tar Pit"
 48mTest Coverage Myth Busted: Test-to-Code Mapping and Test Impact Analytics
 45mUsing AI, statistics, and set theory to know what to test