Gaining Application Lifecycle Intelligence

summary
Shows how Splunk can collect and correlate data across DevOps tools — task trackers, source repositories, build servers and test suites — to provide end-to-end visibility from user stories to production. Demonstrates using Splunk to trace production issues back to the specific code check-in and developer by aggregating distributed, heterogeneous lifecycle data.
AI-written summary · about
chapters (18)
- 0:00Start
- 4:51Platform for machine data
- 7:07What Does Machine Data Look Like?
- 7:47Machine Data Contains Critical Insights
- 9:35Very Extensible Platform for Developers
- 10:21Simple Swarm App (ex Foursquare)
- 26:48Splunk for Application Lifecycle Intelligence
- 30:13End-To-End Visibility Across The Dev Tool Chain
- 39:40Standard Log Files
- 41:04Structured and Unstructured Data
- 43:12Logging best practices
- 45:39Splunk JavaLogging
- 46:59LogBack Appender Example
- 49:02Better Exception Logging
- 49:44Easier to work with in Splunk
- 50:50Splunk SDK for Java
- 56:15Spring Integration Adaptors
- 57:15Inbound Adaptor
related talks
 31mVisibility from Code to Cloud - How pipeline analytics changes how we think about SDLC
 35mLive Demo
 05mhelps deploy modern apps at speed while maintaining security
 29mMeasuring Devops Success with Pipeline Analytics
 01h 33mSplunk as a Big Data Platform for Developers
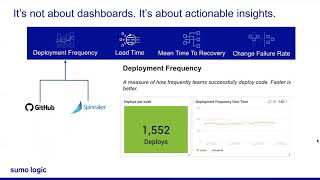 27mBenchmarking and Optimizing Software Delivery Performance
 31mElevating DevOps with Integrating Analytics into CI/CD Pipelines
 34mSecure Product Lifecycle (SPLC) as a Service