Benchmarking and Optimizing Software Delivery Performance
summary
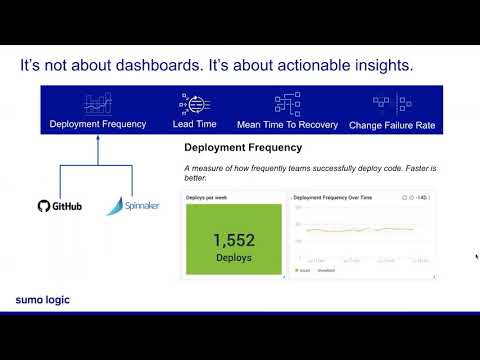
Sumo Logic shows a log-based Software Development Observability pipeline that ingests GitHub, Jenkins, PagerDuty, Jira and Spinnaker events, maps them to a common schema via parsing and Terraform-configured webhooks, and computes real-time DORA metrics (deployment frequency, lead time, MTTR, change failure rate) with raw logs retained for RCA. Demo dashboards surface org-level trends, per-repo drilldowns, pipeline stage durations (Echo logs or a webhook stage pinpoint regression-test bottlenecks) and aligns benchmarks to State of DevOps claims like 200x faster deploys for elite teams.
AI-written summary · about
chapters (13)
- 0:00Introduction to talk
- 1:03Challenges in CI/CD pipelines
- 4:31Solution overview and goals
- 7:02DORA metrics and their impact
- 9:10Calculating DORA metrics with Spinnaker
- 11:37Technical architecture overview
- 13:23Demo setup and folder structure
- 14:45DORA metrics overview dashboard
- 16:08Lead time drill-down analysis
- 17:53Pipeline overview dashboard
- 21:25Pipeline stage monitoring
- 23:32Deployments dashboard
- 25:59Summary and resources
related talks
 29mMeasuring Devops Success with Pipeline Analytics
 30mDeliver Instant Value to Customers
 27mHow We Streamlined Our SDLC with Observability - from GitHUB via Jenkins, Harbor, Argo to K8S
 33mMeasuring Developer Efficiency in DevOps: Key Questions, Metrics, Best Practices
 33mMeasuring DevOps
 05mhelps deploy modern apps at speed while maintaining security
 59mDevSecOps Productivity Metrics and Tools
 42mData-Driven DevOps