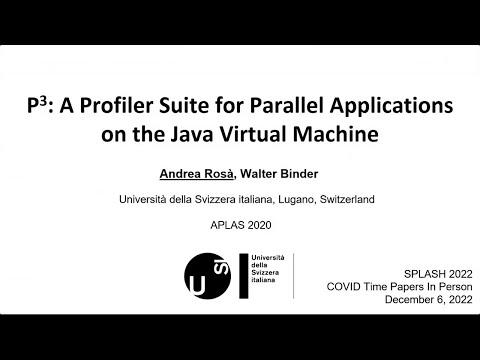
P3: A Profiler Suite for Parallel Applications on the Java Virtual Machine
summary
P3 is a profiler suite for the JVM that actually instruments bytecode (using diesel bytecode instrumentation) and records concrete counts of threads, tasks, actors, futures, lock acquisitions, synchronizers, atomic operations and volatile accesses; it logs events into thread‑local counters, ships them to an analysis server, and produces concise traces. Evaluation across Renaissance shows module overheads near 1.03× for some hot modules and 1.18x total overhead when all modules run, and the diesel reflection API cuts a volatile profiling cost from ~1600× down to ~1.03×, enabling large‑scale analyses.
AI-written summary · about
chapters (11)
- 0:00P3 profiler intro
- 2:48Metrics collected
- 6:27P3 architecture
- 9:20Benchmark integration
- 11:52Implementation details
- 13:42P3 in research
- 14:03Renaissance evaluation
- 19:47Overhead analysis
- 21:32P3 limitations
- 23:42Future work
- 24:23Q&A
related talks
 50mJPoint 2023 TechRadar: Performance Tools
 42mOff-CPU Profiling & Latency Diagnostics in Java
 33mWriting a Java Profiler in Pure Java
 41mUnleash the Power of Open-Source Java Profilers
 40mProfiling Without Pain: Always-On Performance for the JVM
 42mWrite your own Java Profiler in 240 lines of pure Java
 50mObservability Beyond the Three Pillars — Continuous Profiling With Alibaba Dragonwell
 52mProfilers Are Lying Hobbitses