JPoint 2023 TechRadar: Performance Tools

summary
Survey shows 38% of teams rely on integrated IDE profiling, 18% use async-style samplers and 12% use gprofiler-class tools, so expect a practical comparison of perf shows last‑level cache misses and requires up‑to‑date symbol files versus async‑profiler runs in containers, is lightweight, and can emit JFR. Covers heap tools (jmap, MAT), continuous recording, sampling vs instrumentation tradeoffs, pitfalls with JITed code and symbol mismatch, and how to push profiling from a single JVM to cluster‑wide observability.
AI-written summary · about
chapters (13)
- 0:00Introduction
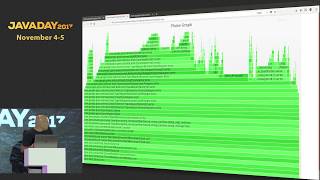
- 3:18Visual profiler issues
- 4:44Profiling with perf
- 8:57Async profiler features
- 13:56Porting profiler history
- 16:27Memory and GC issues
- 23:07Modern profiling approaches
- 28:04GMage microbenchmarks
- 33:27Evolution of profiling tools
- 38:24Continuous profiling
- 41:17Distributed system profiling
- 44:51Request chain analysis
- 47:41Future of system profiling
related talks
 41mUnleash the Power of Open-Source Java Profilers
 52mProfilers Are Lying Hobbitses
 40mA Glance At The Java Performance Toolbox
 23mDon’t Trust Your Profiler: An Empirical Study on the Precision and Accuracy of Ja...
 44mA Glance At The Java Performance Toolbox
 33mWriting a Java Profiler in Pure Java
 50mObservability Beyond the Three Pillars — Continuous Profiling With Alibaba Dragonwell
 46mJava Deep Dive - the ins and outs of profiling