"Auto-Instrumenting Rust Applications Using eBPF and OpenTelemetry"
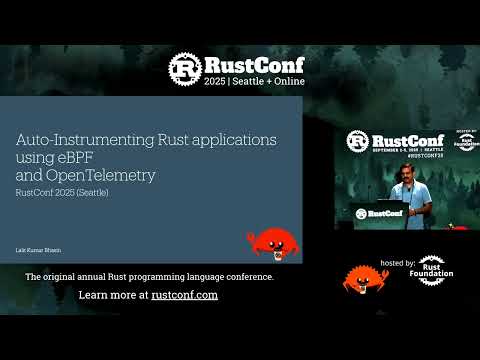
summary
A Rust eBPF pipeline loads kernel probes (using libbpf-rs), attaches uprobe/uretprobe to function entry/exit, generates trace IDs and span IDs in-kernel, writes completed spans to a ring buffer, and a user-space loader reads them and exports OTLP/OpenTelemetry spans. It reliably auto-instruments synchronous native functions across Rust and C++ on Linux without changing app code, but async Rust (Tokio task hops) and HTTP header injection for distributed context remain unsolved—bpf_probe_write_user is removed so level‑7 propagation and safe user-memory mutation currently fail.
AI-written summary · about
chapters (12)
- 0:00Introduction to telemetry
- 0:21Speaker background
- 2:20OpenTelemetry overview
- 6:11Telemetry in Rust
- 9:14Need for auto-instrumentation
- 11:52Understanding eBPF
- 17:23eBPF ecosystems for Rust
- 21:29Implementation via uprobes
- 25:58Challenges with async tracing
- 31:14Context propagation hurdles
- 37:16Requirements and limitations
- 38:12State of the ecosystem and closing
related talks
 37meBPF: Revolutionizing Observability and Telemetry for Modern Applications
 39mAuto-Instrumenting Go Libraries for Tracing with eBPF and OpenTelemetry
 46mTracing the Linux kernel with eBPF and Rust
 31mZero instrumentation observability with eBPF
 42mCommunity Driven Breakout Session: eBPF and Auto-Instrumentation
 45mSimplifying Instrumentation in complex systems at scale with Open Telemetry
 20mStrategies for Auto-Instrumenting Go Applications Without Code Changes
 36mRust in the Kernel (via eBPF)