Dynamic visualisation in the IPython Notebook
summary
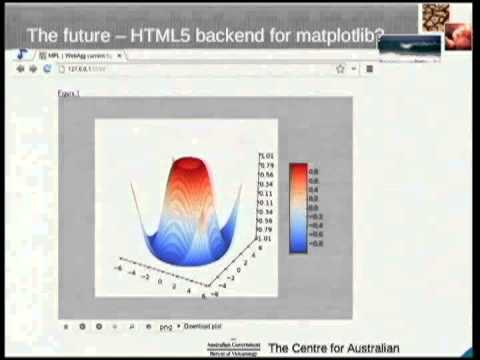
Shows how to embed interactive web maps inside an IPython Notebook by serving gridded data as NetCDF via an OpenDAP server, exposing it as WMS tiles consumed by OpenLayers or Leaflet. Uses a simple genshi HTML template, base64-encodes the page into an iframe to sidestep notebook JS issues, and points out the projection mismatch (EPSG:4326 from OpenDAP vs EPSG:3857 for common basemaps) with practical workarounds like maps.opengeo.org or a cascading WMS. Notes limitations: no alpha on overlays and missing colorbar, and mentions upcoming webagg backend for matplotlib.
AI-written summary · about
chapters (12)
- 0:00Introduction
- 0:25Limitations of Matplotlib
- 2:26Data Source and Map Tools
- 3:41Notebook Setup
- 5:20Rich Display System
- 7:00WMS Mapping Services
- 8:51Introduction to Pydap
- 11:43Server Configuration
- 12:50Projections and Layers
- 15:27Embedding Interactive Maps
- 19:08Alternative Approaches
- 21:45Q&A and Demonstration
related talks
 36mMaking interactive visualizations easy, inside and outside of notebooks
 30mMaps, Maps, Maps!
 30mMeta-Dashboards: Accelerating Geospatial Web Apps Creation with Voilà
 32mAdvanced Visualization in Jupyter Notebooks
 29mUsing Jupyter notebooks to develop and share interactive data displays
 40mData-centric exploration using intake, dask, hvplot, and more
 38mBeautiful, Interactive, and Portable Maps using Folium and Live API Data
 29mInteractive visualization for the curious