Observability at scale

summary
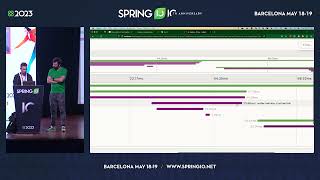
Live demo shows OpenTelemetry for Shiny hooked to a LogFire endpoint with just a few env vars, instrumenting a chat-weather app so developers see exact spans and timings. The app runs ~8s end to end where Claude streaming ~3s dominates, the external tool work runs ~0.65–1.5s (two HTTP calls, one ~100ms, one ~500ms), and Mirai runs tool calls off the main R process as a Mirai background R process; profiling, caching, DuckDB, and nonblocking reactivity are used to reduce spans.
AI-written summary · about
chapters (10)
- 0:00Introduction
- 1:29Demo mechanics
- 3:15What is OpenTelemetry and why use it
- 5:00Integrating OpenTelemetry in R
- 6:27OpenTelemetry vs existing tools
- 7:50Flame graphs for performance
- 9:41Finding bottlenecks in tools
- 11:07Optimizing Shiny apps
- 13:27Next steps
- 15:14Q&A
related talks
 48mObservability of Your Application
 19mOops my app performance sucks... what if observability could be a game changer?
 45mObservability for Modern Spring Applications
 52mIs your JVM app flying blind? Unmask hidden issues with Observability superpowers!
 53mUnmask hidden issues with Observability superpowers!
 01h 02mWhat is your app really doing? Make it tell you with OpenTelemetry.
 40mObservability for All!
 17mOpenTelemetry Looks Good To Me: Loki, Grafana, Tempo, Mimir