Observability of Your Application

summary
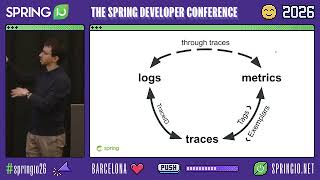
Demo deploys a Spring Boot 3 “teahouse” sample and hooks Micrometer metrics and tracing into Prometheus + Grafana + Loki; dashboards show a steady ~0.5 errors/sec and a heatmap latency jump from ~20–90 ms to ~300 ms, and side‑by‑side traces show 75 ms vs 226 ms for the same request. Traces include JDBC queries and traceID‑correlated logs (searched in Loki) so the missing “English breakfast” DB row is inserted to remove the 404 errors, and added latency is traced to the water service DB (toxiproxy introduced); caching is suggested. Micrometer observation + Micrometer Tracing and OpenZipkin/OpenTelemetry are used.
AI-written summary · about
chapters (21)
- 0:00Introduction
- 3:32Observability demo purpose
- 4:55Tea service demo
- 7:20Metrics and throughput
- 9:51Distributed tracing errors
- 13:27Service graphs verification
- 16:36Logs with trace IDs
- 18:00Traces to metrics
- 20:48Missing tea database fix
- 21:51Latency spikes analysis
- 24:03Water service metrics
- 26:13Setting up alerts for proactive issue detection
- 27:59Micrometer and Prometheus
- 30:07Log correlation explained
- 32:13Spans and latency
- 35:04OpenTelemetry vs Zipkin
- 39:19Micrometer Observation API
- 42:10Monolithic observability
- 44:12Trace ID generation
- 45:58Message broker tracing
- 47:24Q&A
related talks
 45mObservability for Modern Spring Applications
 59mTo Production and Beyond: Observability for Modern Spring Aps
 52mIs your JVM app flying blind? Unmask hidden issues with Observability superpowers!
 53mUnmask hidden issues with Observability superpowers!
 51mI Can See Clearly Now: Observability of JVM & Spring Boot 2-3-4 apps
 55mDemystifying Observability for Spring Applications
 38mObservability 101 with Spring and Micrometer
 58mObservability Beyond the three pillars with Spring