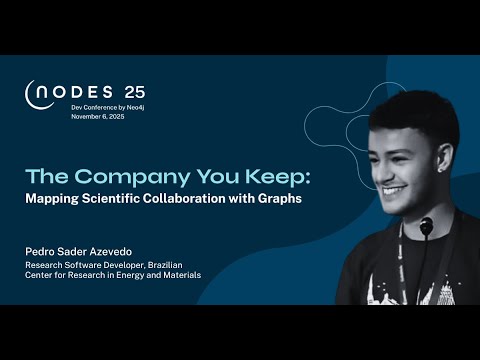
The Company You Keep: Mapping Scientific Collaboration with Graphs
summary
Built a co-authorship graph from Scopus data (2000–2025) for authors with at least one UNICAMP affiliation, modeling author, document, institution nodes plus a helper node and collapsing to an author-only network with edges for shared papers. Used Neo4j and a Python Scopus wrapper (pybliometrics), ran community detection, assigned communities to institutions by majority, then did per-author citation time-series with linear regressions before/after first external collaboration. Result is surprising: the control group outperformed experimental—no clear citation boost after first external collaboration—bachelor thesis received grade 10.
AI-written summary · about
chapters (11)
- 0:00Introduction
- 1:14Choosing the thesis topic
- 2:40Data extraction with Scopus
- 3:46Graph data model explained
- 5:53Building author collaboration graph
- 6:58Community detection in graphs
- 7:40Defining external collaboration
- 8:42Quantitative analysis approach
- 10:09Experimental and control groups
- 10:51Unexpected results and insights
- 12:15Thesis outcome and conclusion
related talks
 28mSearching for Research Fraud in OpenAlex with Graph Data Science
 37mMap of Science: A UI for Open-Source Science
- 37mMap of Science: A UI for Open-Source Science
 40mDiscovering Emerging Open Source Communities Through...
 01h 38mNetwork Science for Fun and Profit
 28mThe GitHub Graph: Open-Source Collaboration Patterns and Neo4j
 20mEgocentric Analysis of Dynamic Networks with EgoLines
 01h 26mBuilding an Interactive Network Graph to Understand Communities