Using a Graph Database Tree and Data Analytics to Model an Ancient River System

summary
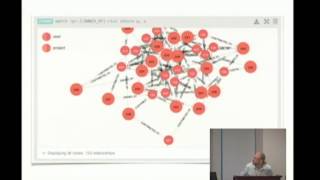
Digitized junctions of the Cretaceous J Sandstone river network become nodes in a Neo4j graph exported as GraphML and visualized in Gephi, with flow directions encoded as directed edges. Applying PageRank to ~hundreds of junctions ranks channel segments by inferred flow strength; high PageRank areas align with published channel maps, greater channel widths and higher porosity/permeability values across the mapped ~150 by 300 mile region, supporting Neo4j Gephi PageRank as a practical workflow.
AI-written summary · about
chapters (8)
- 0:00Introduction to the talk
- 3:19What is a tree structure
- 7:55Can rivers be modeled as trees
- 12:19Modeling river systems in graphs
- 16:37Building the graph database model
- 22:20Why use PageRank algorithm
- 28:52Comparing PageRank to published data
- 30:39Results and oil exploration implications
related talks
 01h 41mGraph Intelligence: Enhance Reasoning and Retrieval Using Graph Analytics
 15mSee What the Graph Sees: Demystifying PageRank Through Visual Storytelling
 24mOur daily graphs written in Ruby and Neo4j
 32mUnderstanding Complexly Connected Data using Graph Databases
 46mGraph Databases: Talking about your Data Relationships with Python
 55mLet Me Graph That For You
 49mWarming up to Graphs
 15mGraphs on the High Seas: UI/UX Considerations for Great Geospatial Graph Visualization