Bringing chart-making out of the back-end

summary
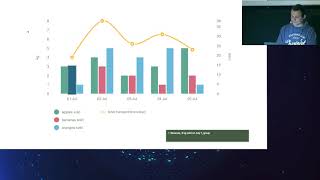
Builds interactive Drupal charts using the Charts module on Drupal 8 with Layout Builder, Paragraphs, Views and Webform workflows; demos include a WHO TB dashboard laid out in a three‑column Layout Builder page with three charts in a row and CSV-sourced data, plus Webform → Views charts from numeric fields. Shows Webform Content Creator turning one submission into three nodes, anonymous users toggling chart type via Views Fields On/Off and Exposed Chart Type. Notes: Layout Builder settings tray needs CSS, Views bogs down past hundreds of points, deNormalizer or DB connector speeds large datasets.
AI-written summary · about
chapters (13)
- 0:00Introduction
- 2:00Overview
- 3:00Scenario
- 3:30Data Dashboards
- 4:23Layout Builder
- 7:34Paragraphs
- 9:24Webform
- 10:22Webform Views
- 18:07Views Fields OnOff
- 21:07Other Resources
- 22:39Questions
- 25:02Talking Points
- 28:54Wrapup
related talks
 51mData Visualization in Drupal
 42m"Site Building 2.0: How Layout Builder will change everything"
 01h 01mThe new Layout Builder: Unleash the Power!
 30mAce any design in Drupal - layout tools and components in your site-building toolbox
 47mWhat's Next for the Layout Initiative
 03mDBTB INT Kyle Hailey r
 24mCreating Interactive Data Visualizations for the Web
 35mAccessible Charts Done Right