Accessible Charts Done Right
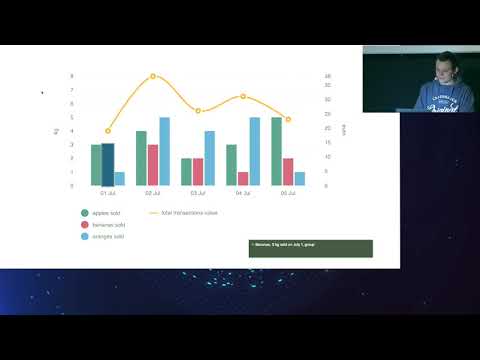
summary
Argues that charts can be fully accessible and shows concrete tactics: attach aria-describedby per point and unique labels so screen readers read each bar, expose data as render tabular export (CSV/Excel) for detailed consumption, and make interactive pieces keyboard-focusable while avoid positive tabindex and provide logical focus order. Recommends skip links between chart elements, fallback HTML tables for full detail, test with VoiceOver/Chrome, and optimize rendering (server-side render or inline critical CSS) for performance.
AI-written summary · about
chapters (6)
- 0:00Introduction and speaker intro
- 3:05Why accessible charts matter
- 12:56Making charts screen-reader friendly
- 20:33Advanced techniques for complex charts
- 27:55Performance and accessibility balance
- 32:16Summary and resources
related talks
 34mAccessible Charts Done Right: Myth or Reality
 41mAccessible Charts Done Right
 24mAccessible charts done right
 01h 02mDeveloping Accessible Charts
 50mAddressing the Core Issue of Data Visualization Accessibility
 48mAccessibility in Data Visualization
 31mDeveloping for Everyone
 21mMusical Charts: Using OSS to Make Data Visualizations Accessible to Visually Impaired Users