Developing Accessible Charts

summary
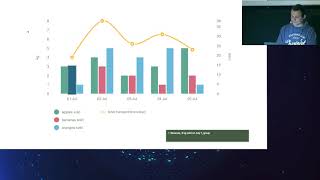
Covers techniques for making data visualizations accessible, focusing on creating inclusive charts with the D3.js library. Presents multiple concrete approaches and live examples showing how people with visual impairments can access information from interactive graphics.
AI-written summary · about
chapters (19)
- 0:00Introduction
- 3:08Charts accessibility
- 7:27Describing charts for screen readers
- 11:46Complex charts accessibility
- 15:15Skip Link pattern
- 21:56Charts and tables
- 26:29Accessible data tables
- 31:303 ways to make charts accessible
- 32:13Accessibility and chart performance
- 35:43Server-side chart rendering
- 37:07Summary
- 40:38Q&A: Certification and testing
- 43:25Q&A: Screen reader metrics
- 46:34Q&A: Dynamic data
- 48:41Q&A: Legacy code
- 51:05Q&A: Screen readers
- 54:38Q&A: Mobile devices
- 56:43Q&A: User testing
- 59:33Q&A: Motivation and future
related talks
 34mAccessible Charts Done Right: Myth or Reality
 41mAccessible Charts Done Right
 35mAccessible Charts Done Right
 48mAccessibility in Data Visualization
 38mAccessibility in Data Visualizations: Two Case Studies
 42mIntroduction to d3 and Data-Driven Charts
 48mVisual Storytelling w/D3-A Conceptual Intro to Visualizing Data w/JavaScript
 15mThe Future of Data Visualization on the Web