PykCharts.js
summary
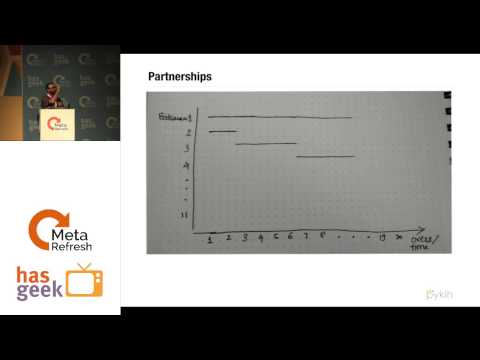
Claims a practical, design-first chart library rather than another wrapper around vague examples: PykCharts.js is built on D3.js, open source, and implements a reductionist visual-encoding approach that reproduces an ESPN cricket scorecard by combining a scatter plot with a Gantt-like batsman timeline. The library ships with a live editor, themeable responsive components, 26+ charts and 109 maps, explicit design decisions, and documentation refined through three iterations, so the demo actually runs and the examples work.
AI-written summary · about
related talks
 42mRefactoring PyChart
 24mWhy are there so many Javascript charting libraries?!?
 03mLightning talk from Alexander Karlsson
 31mbqplot Interactive Data Visualization in Jupyter
 14mThe ABC of Data Visualization
 02h 14mData Applications with Bokeh
 37mData visualization with plotly py: Version 3 and beyond
 29mInteractive visualization for the curious