Using Sloop for Monitoring Highly Available Services

summary
sloop collects Kubernetes object state on a schedule, stores it in BadgerDB without external dependencies, and keeps about two weeks of history (the project shows ~2.8 million docker pulls). The UI presents per-resource timelines with payloads so incidents appear as concrete events: e.g. eviction from ephemeral storage filling that points to a cronjob filling an emptyDir, multi-attach mount error causing pending pods tied to an EKS bug, and auto-balancer node replacements across zones that trigger unexpected pod restarts.
AI-written summary · about
chapters (4)
related talks
 25mAn SLO-Driven Approach to Enhance Kubernetes Cluster Reliability
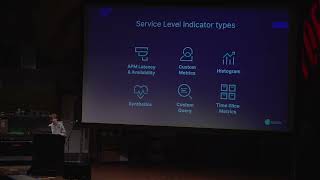 31mServerless Observability: a case study of SLOs
 30mFrom Monitoring to Observability: Left Shift your SLOs with Chaos
 24mTo Make an SLO, First You Must Invent the Universe: OpenTelemetry Collection From Scra...
 18mSLICK: Driving SLO Culture
 29mKubernetes-Defined Monitoring [I]
 40mScaling SLOs with Kubernetes and Cloud Native Observability
 34mSLO-Based Observability For All Kubernetes Cluster Components