Serverless Observability: a case study of SLOs

summary
Elastic migrates observability to Kubernetes by building SLOs on transforms that summarize data and scale across clusters; transforms roll up to one document per minute and a summary index powers fast SLO computation. SLO types used: APM latency/availability, custom KQL, histogram time-slices and synthetics (coming). Burn‑rate alerts use multiple windows (short = 1/12 of long) and four severities though teams often keep just low and critical; grouping by fields produces many instances (group-by creates multiple SLOs per project ID). Outcome: system mostly works but exposes measurement and multi‑cluster definition pitfalls requiring continuous tuning.
AI-written summary · about
chapters (17)
- 0:00Introduction and speaker intro
- 1:27Why Elastic adopted SLOs
- 2:56Key SLO definitions and concepts
- 4:43Transforms and data rollup
- 6:31SLO architecture and benefits
- 7:38SLOs in observability workflow
- 9:24Defining good versus bad SLOs
- 10:07Types of service level indicators
- 11:12SLI examples from production
- 13:45Grouping SLOs by fields
- 14:52SLOs for developers and APIs
- 15:35Burn rate alerts explained
- 17:46Live demo of SLO creation
- 21:32Managing SLOs via APIs
- 22:53Scaling SLOs for large organizations
- 24:18Future SLO features and integrations
- 26:28Q&A session
related talks
 30mFrom Monitoring to Observability: Left Shift your SLOs with Chaos
 25mAn SLO-Driven Approach to Enhance Kubernetes Cluster Reliability
 40mScaling SLOs with Kubernetes and Cloud Native Observability
 37mUsing SLOs for Continuous Performance Optimizations of Your K8s Workloads
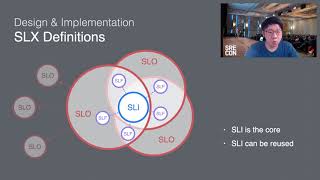 31mSLX: An Extended SLO Framework to Expedite Incident Recovery
 38mTransforming Production Readiness
 22mLook Ma, No Metrics: A Quest Towards Extracting SLOs
 35mFrom Monitoring to Observability: Left Shift your SLOs with Chaos