Interactive Visualizations and UIs in Julia
summary
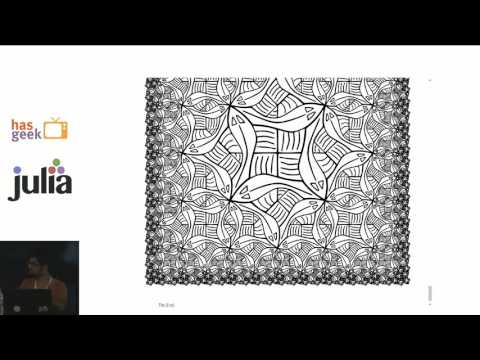
Shows concrete tooling: Gadfly and PyPlot for plotting, IJulia to run notebooks, Interact to add interactive sliders and widgets, and Escher to generate Escher web apps (no custom JavaScript). Demonstrations include a live Jupyter notebook, animated plots updating at ~30 fps, a recursive MC Escher–style graphic built in Compose, and reactive behaviors wiring buttons to counters. Everything renders to SVG/HTML and the demos visibly work, proving end-to-end interactivity with Julia packages.
AI-written summary · about
chapters (7)
- 0:00Start
- 9:03The Elem type
- 10:39Custom Elements
- 11:12Content: Textual
- 12:57Functional Geometry
- 13:58Layouts
- 15:00Typography
related talks
 29mInteractive visualization for the curious
 24mPractical examples of interactive visualizations in JupyterLab...
 21mDemo: A functional EDSL for mathematics visualization that compiles to JavaScrip...
 47mUsing Julia & D3 to analyse web performance data
 01h 08mThe quest for the graphical web
 01h 16mMake your research interactive with Jupyter Dashboards
 21mVisualizing data with JavaScript at Twitter
 20mSupercharge Your Shiny (for Python) App: Unleashing Interactive Jupyter Widgets