Maximizing performance with GraalVM

summary
GraalVM shows concrete wins: using JMH for measurements, escape analysis removes allocations so boxed-int and array allocations vanish in practice, and some HotSpot vs Graal comparisons show up to ~30x slower on HotSpot for complex Stream-heavy microbenchmarks. Building a native-image produces small standalone binaries (~7–16 MB in demos), cuts Micronaut startup from ~1.8s to ~20ms and RSS from ~300 MB to ~28 MB, and compiles javac runs from ~600 ms to ~49 ms. The native-image snapshotting works but requires explicit reflection/dynamic-loading config.
AI-written summary · about
chapters (11)
- 0:00Introduction to performance
- 1:03Performance metrics explained
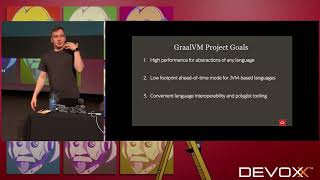
- 4:34Overview of GraalVM
- 7:45Escape analysis demo
- 13:28Benchmarking abstractions
- 19:10Stream API optimizations
- 23:44Native image technology
- 30:53Native image demo
- 37:25Memory usage analysis
- 43:46Polyglot capabilities
- 50:07Production readiness and Q&A
related talks
 45mMaximizing performance with GraalVM
 52mMaximizing Performance With GraalVM
 56mMaximizing Performance with GraalVM
 20mMaximizing Java Application Performance with GraalVM
 42mJava in the Cloud with GraalVM
 03h 07mEverything you need to know about GraalVM
 44mJava In The Cloud with GraalVM
 34mFast and Efficient Java Microservices with GraalVM