Debugging Go Applications

summary
Starts from a tiny Go API that returns 500s and moves it to observable production readiness using concrete tools and numbers: live debugging with a delve-style debugger to find a local connection refused, adding structured slog JSON logs shipped to Elastic/Kibana via filebeat, exposing Prometheus metrics (/metrics) with VictoriaMetrics, adding pprof and OpenTelemetry traces viewed in Jaeger to spot a 2.01s hotspot in getFlight. Case study shows a Cloudflare-scale crawler hints system handling 18–30k req/s (later 100x) and relying on metrics, sampling and rate-limit workarounds that reduce incidents.
AI-written summary · about
chapters (15)
- 0:00Debugging Go apps
- 1:46Debugging skills matter
- 3:37Debugging a simple Go API
- 7:14Diagnosing 500 errors
- 9:04Go’s built-in debugger
- 12:37Structured logging with slog
- 18:22Logs to Elasticsearch and Cabana
- 23:17Too many logs problems
- 23:39Metrics for visibility
- 29:16Alerts for debugging
- 33:11Distributed tracing with OpenTelemetry
- 39:53Service maps from traces
- 41:19Journey to distributed tracing
- 42:42Cloudflare debugging
- 46:13Q&A
related talks
 40mInstrumenting GO Applications
 30mDynamically Instrumenting Go Programs
 31mDebugging Go: from zero to Kubernetes - Michele Caci
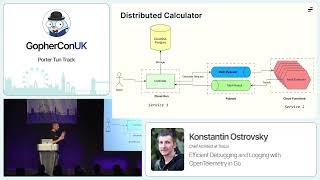 39mEfficient Debugging and Logging with OpenTelemetry in Go
 30mMastering Distributed Tracing with Go
 40mDebugging in Golang Apps Inside K8s Environment
 34mChaos Debugging: Finding and Fixing Microservice Weak Points
 48mProfiling is for Dev, Monitoring is for Ops – no more!