Instrumenting GO Applications

summary
Shows how to add tracing, logs and metrics to Go services using concrete code: stdout exporter then Jaeger UI for traces, HTTP propagation with a B3 propagator, zero log hooks to attach trace and span IDs to logs, and a Prometheus exporter scraped successfully. Demonstrates an OpenTelemetry Collector deployment and sidecar/operator pattern to avoid vendor lock‑in (send to AWS X‑Ray, Datadog, Grafana), and cites a real catch — a service spinning for ~30 seconds — found via traces.
AI-written summary · about
chapters (19)
- 0:00Start
- 1:03Chris Reeves
- 3:54Pillars of Instrumentation
- 4:49Tracing
- 5:53Discover Performance Bottlenecks
- 6:47Logging
- 8:14Trace and Span Ids
- 8:43Metrics
- 10:16Where Does Open Telemetry Fit in
- 12:41Tracing Api
- 14:36Go Sdks
- 16:51Init Method
- 22:34The Go Mod File
- 24:19Start a Http Server
- 25:51Http Client
- 27:20Logs
- 32:52Open Telemetry Collector
- 36:40Wrapping Up
- 39:17Do You Keep Your Same Trace Id for the Queue or Do You Create a New Trace Id
related talks
 19mInstrumenting Go Apps With OpenTelemetry
 34mOpenTelemetry for Dummies: Instrumenting Go Apps
 02h 02mHow To Troubleshoot and Monitor Applications using OpenTelemetry
 42mObservable Applications Using OpenTelemetry
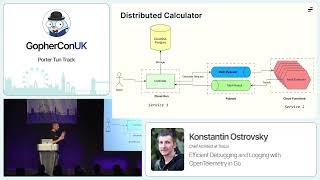 39mEfficient Debugging and Logging with OpenTelemetry in Go
 30mMastering Distributed Tracing with Go
 51mPractical introduction to OpenTelemetry tracing
 58mOpenTelemetry 101