Getting started with Grafana Loki, a modern logs database

summary
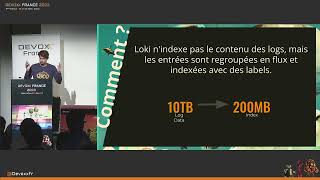
Grafana Loki indexes metadata only instead of full text, stores all persistence in an object store only (S3/GCS/filesystem), and ingests via Promtail, Grafana Agent or Fluentd. Queries use LogQL to parse logs, extract fields and generate metrics or alerts (Alertmanager), and recording rules push results to Prometheus. A managed cluster runs ~4,000 tenants, ingests ~16 TB and hits ~1 TB/s query throughput, with per-tenant retention and period config migrations to swap storage without copying.
AI-written summary · about
chapters (7)
- 0:00Start
- 31:53How it works: Query Path
- 36:57Patterns and Practices: Logging
- 42:23Patterns and Practices: Slow queries
- 46:11Patterns and Practices: Recording rules
- 47:56Patterns and Practices: Essential configs
- 51:17Summary
related talks
 44mIntroduction to Grafana Loki
 37mGrafana Loki: Like Prometheus, But for logs.
 31mLoki: Like Prometheus But for Logs
 05mGrafana Loki Log Aggregation for Incident Investigations
 25mLoki: Prometheus-inspired logging for cloud native
 28mFrom Fragmented Logs to Unified Insights: Scaling O11y
 01h 02mThe Power of Metrics, Logs & Traces with Open Source
 32mWhat’s new with Grafana Labs’s Open Source Observability stack