Introduction to Grafana Loki

summary
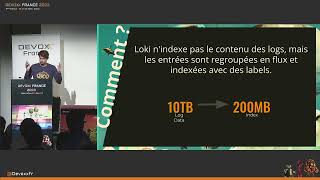
A concrete introduction to Grafana Loki that reports running Loki in production for five months, using promtail to send files and journald via TCP/syslog to a single Loki binary with ingester/distributor/querier components. Loki stores to local disk or cloud backends (S3/DynamoDB style), exposes an API and integrates with Grafana Explore and dashboards, and deliberately uses no full-text indexing — only labels like job, filename, pod — which keeps storage and cost low. A live demo is shown; basic workflows work though live tailing can be flaky.
AI-written summary · about
chapters (27)
- 0:00Introduction
- 7:50Demo
- 9:55Logs
- 10:12Configuration
- 14:27Rows
- 15:16Exploding Refer
- 16:21Explore
- 17:10Love Letters
- 17:29Review
- 19:50Loglines
- 21:45Filtering Loglines
- 22:27Creating Table
- 23:12Excluding Text
- 24:07Excluding Rocks
- 25:05Infielder
- 25:37Duplication
- 26:57Explosion of Preference
- 27:09Training Manual
- 27:27Live Demo
- 30:07Life View
- 30:43Matrix Mode
- 31:29Diamond Count
- 32:03Pin
- 33:13Network Matrix
- 35:05Lucky Bucket
- 36:47Integration
- 38:09Further Questions
related talks
 53mGetting started with Grafana Loki, a modern logs database
 37mGrafana Loki: Like Prometheus, But for logs.
 05mGrafana Loki Log Aggregation for Incident Investigations
 31mLoki: Like Prometheus But for Logs
 25mLoki: Prometheus-inspired logging for cloud native
 15mOperations report: Running Loki on Different On-Prem Environments
 22mAdding Observability to HashiCorp Nomad Applications with Grafana
 25mGrafana as Code-An Open Source Observability Solution