What Did the AI Just Do?: Making LLMs Observable with Open Telemetry
summary
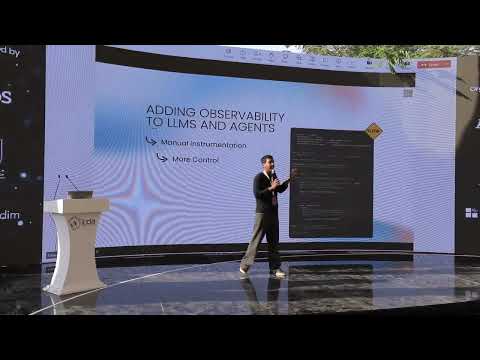
Demonstrates that a single runtime call to OpenLit instruments OpenTelemetry and captures LLM inputs and outputs, temperature and token counts without changing deployment; traces and metrics land in Tempo and Mimir and show full agent chains (web searches, vector DB calls, LLM invocations, URLs and request bodies). Live demo of a trip‑planner agent produces a complete trace, lets an AI assistant summarize failures (hallucinations, cost hotspots), and reveals per‑model token usage so engineers can debug and optimize.
AI-written summary · about
chapters (9)
- 0:00Introduction to AI observability
- 1:04Challenges with LLM applications
- 3:57How LLM apps differ from traditional software
- 5:21Observing LLM applications with OpenTelemetry
- 7:06Introducing OpenLit framework
- 9:38Layered observability for LLMs
- 11:11Live demo with Grafana visualization
- 14:23Analyzing LLM costs and usage
- 15:07Q&A and closing remarks
related talks
 18mWhat did AI just do? Making LLMs Observable with OpenTelemetry
 01h 02mObserving AI Applications with OpenLit and OpenTelemetry
 33mWhat Did My Agent Do? Observability and Accountability for AI Agents
 31mDeep Dive To AI Agent Observability
 30mTutorial: Building an Observable AI Agent With an Open Source Stack
 32mFrom Traces To Action: Auto-Instrumenting LLMs for Observability...
 40mOptimizing AI Applications for Production with Observability
 40mKeep AI on Track: Guardrails + OpenTelemetry Observability