How We Gained Observability Into Our CI/CD Pipeline

summary
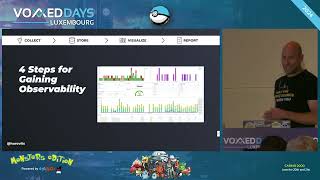
Jenkins pipelines emit environment variables that get turned into JSON and stored in Elasticsearch/OpenSearch so dashboards answer which step, branch, or machine fails and why; traces use OpenTelemetry -> Jaeger to show per-job spans; metrics use Telegraf -> Prometheus -> Grafana for JVM/container health; alerts and a daily Slack report reduce manual checks and shorten lead time for changes. The implementation follows collect store visualize report and measurably improves cycle time and on‑call load.
AI-written summary · about
chapters (8)
- 0:00Introduction and context
- 1:54Challenges in CI/CD monitoring
- 4:45Gaining pipeline observability
- 8:43Implementing the observability stack
- 17:54Analyzing flaky tests
- 20:01Adding distributed tracing
- 27:53Monitoring environment metrics
- 33:33Summary and Q&A
related talks
 26mHow We Gained Observability Into Our CI/CD Pipeline
 44mHow We Gained Observability Into Our CI CD Pipeline
 35mGaining Observability Into Your CI/CD Pipeline
 55mHow We Gained Observability Into Our CI/CD Pipeline
 28mEnd-to-end CI/CD observability with open source
 30mMaking your CI/CD Pipelines Speaking in Tongues with Open...
 27mHow We Streamlined Our SDLC with Observability - from GitHUB via Jenkins, Harbor, Argo to K8S
 23mDashboards for DevOps: How to Set Up the Right Reports