...Scaling Visualization in concurrent C++ programs

summary
High-resolution timeline profiling instruments code with RAII-style collectors that allocate into a thread-safe memory pool and hand off to processor threads, then to a disk-backed sparse pool via mmap/msync, successfully sustaining roughly one event per 100 microseconds per thread on 32 cores. The system measures real time and per-thread CPU time, avoids heavy locks with atomic bump allocators and TLS depth counters, and shows concrete failures: lock contention, serialization, memory-bandwidth limits, and excessive work inside critical sections.
AI-written summary · about
chapters (36)
- 0:00Introduction
- 2:43Why measure performance
- 3:42Why write concurrent programs
- 4:28Profile concurrent programs
- 9:00Threadscope
- 10:41RealTime
- 12:50Memory Bandwidth
- 15:24Bonus Example
- 17:14Herb Lowlog Q
- 27:37Nested Measurement
- 28:12Data Management
- 29:13Memory Allocation
- 30:24Memory Pool
- 31:20ThreadSafe Memory Pool
- 32:06Memory Depth
- 34:05Threads
- 34:39Recap
- 35:12Profiler
- 36:05Infinite Memory
- 36:19Virtual Memory
- 38:02Page Table
- 41:19Logical Pages
- 42:13Sparse Files
- 43:32Simple Memory Pool
- 44:35The Easy Way
- 46:29Measure it
- 47:33Measurement Practice
- 48:36The Hard Part
- 50:08Annotations
- 51:25UI
- 52:45Questions
- 58:03Memory Pools
- 58:28Data Races
- 58:45Sweep Thread
- 59:18Disk Pool
- 59:28Two Threads
related talks
 48mReal time 101
 52mBest Practices for Concurrency
 59mC++ on its way to exascale and beyond
 01h 02mAn Introduction to Tracy Profiler in C++
 48mConsiderations for choosing the parallel computing strategy
 59mParallel Programming in Rust: Techniques for Blazing Speed
 52mC++ Game Development - Techniques to Optimise Multithreaded Data Building
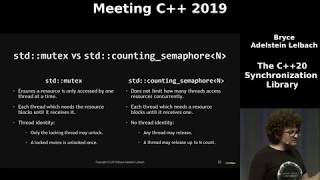 01h 04mThe C++20 Synchronization Library