Building Highly Interactive Charts using Angular Directives

summary
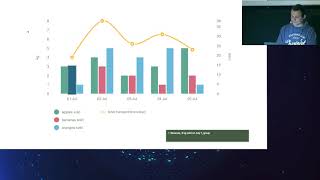
Shows how AngularJS directives are used together with Highcharts to build highly interactive charts, continuing from an earlier talk and demonstrating the actual charts implemented. Mentions that the recorded video suffers muffled audio due to heavy noise cancellation.
AI-written summary · about
related talks
 38mStorytelling with your data
 40mAdvanced UI, Plugins and Components in AngularJS
 33mDemystified Angular Directives
 31mBuilding games with AngularJS
 15mThe Future of Data Visualization on the Web
 35mAccessible Charts Done Right
 28mGetting Started with D3.js
 43mAngular and React: friends learning from each other