Affective Data Visualization (CW)
summary
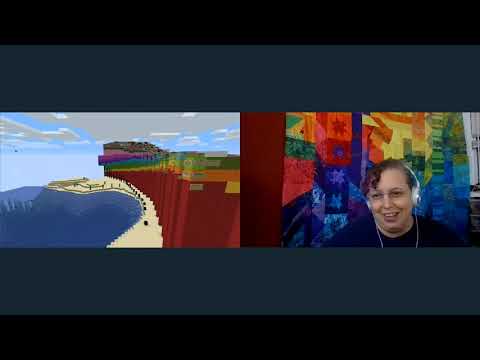
Minecraft walls model WHO daily situation reports with each block = 200 cases, building one wall per report so the pandemic literally grows line by line and deaths appear as a separate black row with each block = 200 deaths. Project uses a friend server and the WorldEdit plugin, walls take ~4 hours so only every fifth day is rendered, and comparisons show COVID relative scale to SARS, H1N1 and average daily causes of death.
AI-written summary · about