DTrace for Rust... and everything else too!
summary
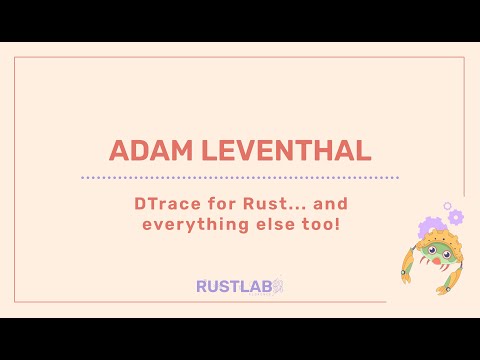
DTrace is shown instrumenting Rust binaries end to end using the USDT crate from Cargo, dynamically creating 240,000 probes for a running process and aggregating function-call counts and microsecond histograms. MacOS ARM users get working probes and a live demo proves assembly-backed macros and closure arguments let expensive serialization be skipped when a probe is off, delivering a practical zero disabled probe effect while admitting enabled probes can still cost CPU and code size.
AI-written summary · about
chapters (10)
- 0:00Introduction to DTrace
- 2:00Core values of DTrace
- 6:49DTrace instrumentation history
- 10:25User-land and dynamic tracing
- 13:32DTrace for Rust: live demo
- 24:07USDT implementation in Rust
- 26:47Handling complex data types
- 33:04Advanced probe macros
- 37:15Reflections and closing
- 40:32Q&A session
related talks
 27mImproving Rust Performance Through Profiling and Benchmarking
 25mSyscalls for Rustaceans
 24mRust performance debugging with TUIs and LLMs
 40m"Auto-Instrumenting Rust Applications Using eBPF and OpenTelemetry"
 19mCounterexamples in Safe Rust
 41mDemistifying Rust Debugging
 33mBeyond println!: Mastering Rust Debugging
 27mClosing Keynote