Monthly Operations Review

summary
Presents a six-metric operations report used for six months across 13 projects to give a clear view of project health and support timely decisions. Data is automated from JIRA and Tempo into an Excel template with filters and formulas; the report includes burn-down, velocity, component defects, test-case coverage, and automation rate, with example charts and per-project numbers.
AI-written summary · about
chapters (11)
- 0:00Career in testing
- 1:27Dev team roles
- 2:34Project management
- 3:59Time logging
- 5:02Data collection
- 6:45Time distribution
- 8:12Time fixes
- 9:17Defect metrics
- 10:21Test coverage
- 11:49Automation impact
- 13:15Q&A
related talks
 20mHow to Communicate Metrics to Build Engagement
 31mA Successful DevOps Initiative Starts with Knowing Your Numbers
 36mThe Development Metrics You Should Use (but Don’t)
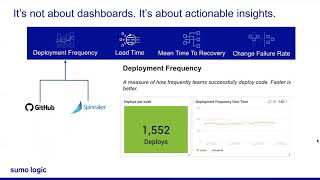 27mBenchmarking and Optimizing Software Delivery Performance
 28m05 how we do developer productivity panel
 14mEssential Metrics for the Quality Assurance
 01h 02mImproving Performance of Agile Teams using Statistical Analysis
 44mEnhancing the Performance of Engineering Teams