Remove before flight: Analysing flight safety data.
summary
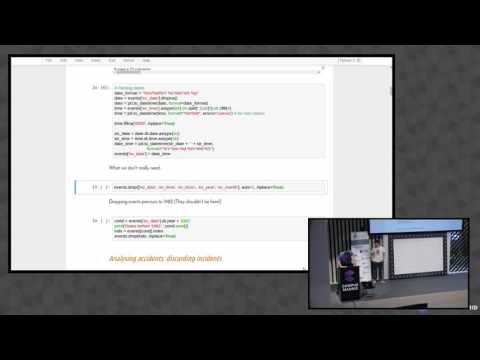
Uses the NTSB database with Pandas, Scikit‑learn to read and clean records, parse DMS lat/long and geocode city/state via Google to reduce missing locations to 44 entries, yielding ~1,500 Part‑121 commercial accidents for analysis. Builds maps and time‑series plots, runs regression and clustering; finds landing/approach account for most accidents, takeoff has the highest fatalities, taxi appears surprisingly often, pilot median age ~44 with younger pilots over‑represented, and fatality rate per passenger declines over 30 years despite periodic spikes.
AI-written summary · about
chapters (25)
- 0:00Flight safety analysis intro
- 1:15Why flight safety data
- 2:26Aviation safety stages
- 3:37Accessing accident data challenges
- 5:27Tools and data sources
- 6:23Exploring flight safety DB
- 7:51Filtering commercial flights
- 9:19Relevant flight types
- 11:33Loading dataset
- 11:54Mapping accident locations
- 14:53Accident hotspots near airports
- 16:07Flight phases and risks
- 17:15Decoding flight phase codes
- 19:33Damage and injuries by phase
- 20:15Visualizing accident impacts
- 23:09Accident occurrence patterns
- 25:27Grouping accident causes
- 26:31Common accident causes
- 27:54Pilot experience by age
- 29:43Normalizing pilot age
- 31:52Pilot experience in hours
- 35:26Is air transport safer?
- 37:11Normalizing fatality rates
- 38:35Challenges and conclusions
- 40:47Q&A
related talks
 42mFlying Python at 40,000 feet
 42mPython flying at 40,000 feet
 35mTouchdown Localisation with aircraft flight data
 18mSit back, relax, and enjoy the talk: a journey through FlightRadar24 with Python
 39mUsing a modern data stack to explore & visualize the impact of a global pandemic on airline traffic
 23mEmpowering pilots: How GE Aerospace FlightPulse uses Mapbox to elevate safety and sustainability
 10mWhy So Loud! Geeking Out On Airline Data, Physics And Mapping
 17mFlight of Insights: Navigating Data Turbulence with SQL Modelling and Visualisation