Creating Interactive, Animated Reports in Streamlit with ipyvizzu

summary
Shows an actual integration: Streamlit + ipyvizzu component that embeds Vizzu animations inside Streamlit apps, with widget-driven interactivity (sliders, toggles, clicks), caching for slow ops, and examples: Titanic, music-revenue, superheroes. Demonstrates a Builder app for code snippets and a racing-bar demo, creates a downloadable animated HTML story of every interaction, and supports sorting and aggregation (default sum, changeable to mean/min). The demos run live via a GitHub repo/Codespaces and work end-to-end though some features are early-stage and occasionally glitch.
AI-written summary · about
chapters (12)
- 0:00Workshop intro
- 1:11Session expectations
- 2:14Streamlit + ipyvizzu demo
- 5:28ipyvizzu animated stories
- 8:44Streamlit intro
- 15:10Streamlit core features
- 25:28ipyvizzu Builder hands-on
- 33:46ipyvizzu app examples
- 41:56Q&A
- 54:29Guided hands-on build
- 57:19Breakout rooms setup
- 1:00:07Sharing feedback
related talks
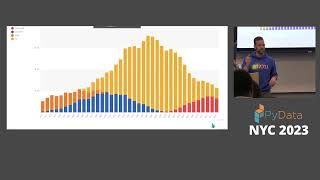 58mCreating Interactive, Animated Reports in Streamlit with Vizzu
 38mBuilding interactive reports in Streamlit with ipyvizzu
 01h 31mHands-on intro of ipyvizzu-story
 01h 26mipyvizzu-story- a open-source tool to build create+share animated data stories w/ python in jupyter
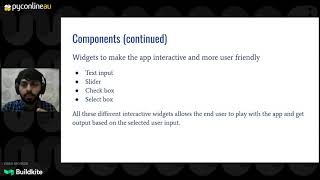 26mStreamlit - Build interactive data dashboards quickly
 40mUse animated data stories in Jupyter to present
 41mInteractive Visualization in Jupyter with Bqplot and Interactive Widgets
 30mMeta-Dashboards: Accelerating Geospatial Web Apps Creation with Voilà