Getting Started With Bokeh
summary
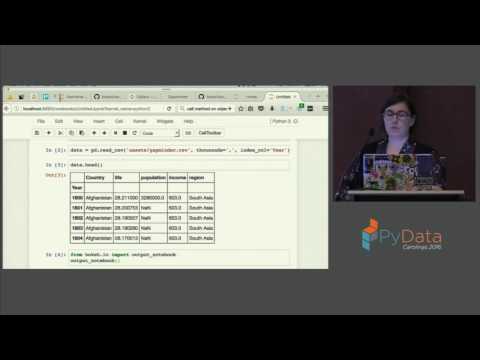
Introduces Bokeh, the Python interactive visualization library that renders in web browsers, and explains core concepts. Demonstrates building visualizations from a basic scatter plot up to an interactive dashboard that lets users run a clustering algorithm selected from a dropdown.
AI-written summary · about
related talks
 01h 31mBokeh for Data Applications and Visualization
 39mGetting started with Bokeh / Let's build an interactive data visualization for the web..in Python!
 59mBig data beautiful visualization on the browser with Bokeh
 42mBokeh and Friends
 02h 14mData Applications with Bokeh
 01h 55mInteractive Data Visualizations with Python
 26mDeveloping Dashboard Applications using Bokeh
 45mDeveloping Dashboard Applications Using Bokeh