Python based predictive analytics with GraphLab Create

summary
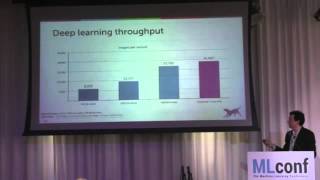
Shows how to build and deploy a real predictive app that combines tables, graphs, text and images using GraphLab Create and its SFrame engine, feeding models to a RESTful predictive server. Demonstrates a 350k‑row web‑session demo, graph analytics (largest component ≈22,000 nodes) and PageRank, image similarity, sentiment and recommender pipelines. Claims 50× speedups versus scikit‑learn on some workloads, automatic feature expansion, multi‑core and disk‑backed scaling, and live demos that actually return recommendations.
AI-written summary · about
chapters (11)
- 0:00GraphLab Create intro
- 1:30Predictive apps pipeline
- 3:57Real-world analytics projects
- 7:50Sentiment analysis demo
- 10:37Image similarity demo
- 11:43Movie recommendations demo
- 13:28Web logs analysis demo
- 22:38GraphLab architecture
- 24:26Performance vs scikit-learn/Spark
- 27:18Customer use cases
- 28:52Q&A
related talks
 40mPython based predictive analytics
 23mHow Can We Trust Machine Learning? Exploration, Evaluation...
 17mCarlos Guestrin, CEO of Dato Inc. @ MLconf SEA
 37mBuild a Data-Driven Web App That Everyone Can Use
 46mKeynote: How Can We Trust Machine Learning?
 34mPython as a Framework for Analytics and Growth Hacking
 28mAdvanced Graph Visualizations in Jupyter Notebooks
 02h 00mData Science Driven Business Insights with Python and PySp