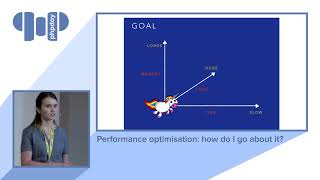
Performance optimisation: how do I go about it?

summary
A simple PHP app called cigar gets profiled with xdebug, xhprof and benchmarking (ApacheBench / wrk) to find the real bottlenecks, not micro‑tips. Profiling with qcachegrind plus meminfo exposes a slow parse/closure and unnecessary PI work, cutting runtime from ~3.0s to ~0.3s and halving memory by switching file access and removing retained parser objects. Micro‑optimisations (quotes, ===) save milliseconds; evidence and tooling drive changes.
AI-written summary · about
chapters (6)
- 0:00Start
- 12:24MICRO OPTIMISATIONS
- 17:20TOOLS FOR PHP
- 18:14INSTALLING EXTENSIONS YMMV
- 20:05INSTALL A PROFILER
- 24:34BASELINE FIRST
related talks
 47mPerformance optimisation: how do I go about it?
 50mPerformance optimization: how do I go about it?
 39mPHP Performance Demystified - Measure, Understand, Optimise
 35mPHP: Performance and application development — what we diagnosed
 31mNo more slow requests
 01h 03mMaximising Performance With Zend Framework
 01h 02mSpeeding up the Web with PHP 7
 01h 12m25 Years of PHP