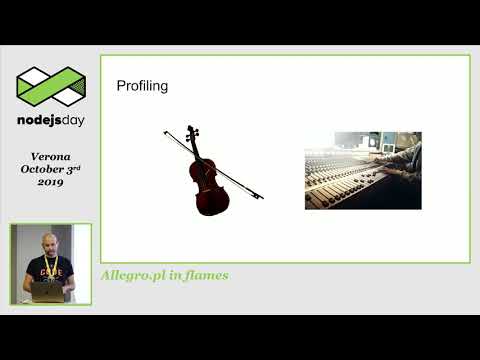
Allegro.pl in flames
summary
Allegro’s OpBox gets profiled with flame graph analysis using --prof and 0x for visualization then compared to perf; profiling in production finds heavy JSON.parse time and excessive array.map cost, so maps become plain loops and rendering speed improves about 11.2%. IPC to workers shows ~30 ms latency in dev; swapping to worker_threads with postMessage shrinks IPC in benchmarks but yields only a 1–2 ms production gain until a Node bug is fixed.
AI-written summary · about
chapters (8)
- 0:00Start
- 2:02Front Page
- 3:47Typical Data Flow
- 6:14Instrumenting Profiler
- 6:37Sampling Profilers
- 13:38Flame Graph
- 16:07Rendering
- 21:36Benchmark
related talks
 01h 32mBlazing Performance with Flame Graphs
 01h 02mProfiling Node Applications
 48mFantastic Performance and Where to Find It
 49mWorkshop: How to use flamegraphs to find performance problems
 40mPerf Stories
 33mReaching Ludicrous Speed
 47mPerformance optimisation: how do I go about it?
 29mProfiling Node Applications