Allison Gilmore, Data Scientist, Ayasdi

summary
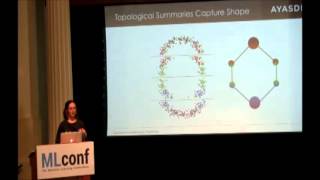
Uses a lens function (for example y-axis projection or a density estimator), creates overlapping value bins, clusters each bin, and outputs a graph whose nodes are local clusters and edges mark shared points so the graph recovers shape. Shows a noisy circle recovered exactly, finds a loop-shaped disease progression across humans, mice and bacteria rather than a linear continuum, and maps perioperative sequences for total knee replacement into regions of care paths, enabling a decision support tool that isolates paths with unusually low length of stay.
AI-written summary · about
chapters (9)
- 0:00Intro
- 0:39Shape as Organizing Principle
- 2:49Geometry or Topology
- 5:01Topological Summaries Capture Shape
- 8:25Enhancing Traditional Methods
- 12:55Disease State & Model Choice
- 14:30Topological Model for Total Knee Replacement
- 16:51Carepaths for Total Knee Replacement
- 17:28Beating the Curse of Dimensionality
related talks
 20mAllison Gilmore, Data Scientist, Ayasdi
 26mAnthony Bak, Principal Data Scientist and Mathematician, Ayasdi
 28mAnthony Bak, Principal Data Scientist at Ayasdi @ MLconf SEA
 06mComplex Data Analysis
 01h 00mData, visualization, and designing AI
 50mThe Shape of Data: Machine Learning and Topology
 27mCelebrating Neurodiversity Through Aesthetic Data Visualization
 27mDr Prakash Data Science Manager, ZS Associates at Cypher 2017