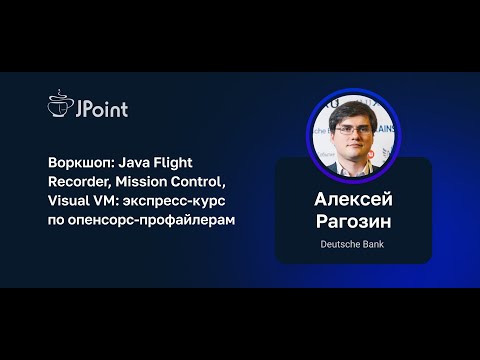
Workshop: Crash Course on Open Source Profilers (part 2)
summary
Hands-on workshop that demonstrates open-source Java profilers Mission Control and VisualVM to diagnose problems like increased load, slow performance, and memory leaks. The session shows practical use of these free tools to profile and analyze Java applications.
AI-written summary · about
chapters (11)
- 0:00Workshop introduction
- 1:51Profiling package analysis
- 7:11Code algorithmic issues
- 12:38Beatrice tool
- 21:29Mission Control overview
- 24:49Flight Recorder setup
- 32:41Stack trace sampling
- 44:17Filtering and threads
- 46:55Heap dump analysis
- 52:28Memory leak detection
- 1:09:46Conclusion
related talks
 41mUnleash the Power of Open-Source Java Profilers
 01h 01mProfiler perf and the JVM (Part 2)
 45mMastering JVM Profiling: Advanced Techniques and Real-Life Case Studies
 55mWhat's Going On in Java?
 45mThe perf Profiler and the JVM (Part 1)
 46mJava Deep Dive - the ins and outs of profiling
 46mCPU Profiling on the JVM and Flame Graphs
 39mFive most useful profiling techniques to use with modern Java apps