Making Big Data Useful Data

summary
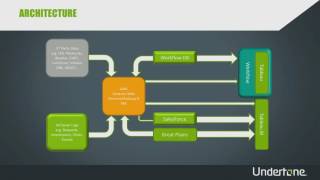
Company logs roughly 15 billion events a day into Hadoop (about 200 nodes) and a column store, models data into QVDs for ClickView, and adds a cohort layer to avoid duplicating dimensional work. Reporting pipeline produces time‑series and install cohorts, yielding performance, dependability and trust. Internal tools like QV Helper and Master Portal plus Usage Insight track report dependencies and consumption, letting teams prune or fix reports — practical, deployed, and used to cut load and improve consistency.
AI-written summary · about
chapters (26)
- 0:00Introduction
- 0:18Anna Bongenhielm Producer Data Analytics @ King
- 0:47We make great games
- 1:57The evolution of King
- 3:05Presentation overview
- 4:38The Daily Pipeline
- 5:59Tracking measures what players do
- 6:59Our fancy data pipeline!
- 8:18Brief Reporting History
- 8:28In the beginning
- 9:34The problems we face with size
- 10:26Our QMC
- 11:46Dealing with Data Size in the Reporting Layer
- 12:19Original architecture
- 12:39Occasional architecture
- 13:15Architecture with a logic layer
- 14:26Architecture with a cohort layer
- 15:02User experience
- 16:11Governing the User End of a Big Data Environment
- 16:50Our Framework: What issues does it address?
- 17:30How do we do this?
- 19:11Tools - QV Helper
- 20:11Tools - Master Portal
- 21:52Tools - Usage Insight
- 23:04Getting the Stakeholders the Right Thing
- 28:56Questions?
related talks
 02h 05mBig Data and the Data Lake from the Analyst Perspective
 30mAn architecture for big data: Supporting journalism through transparency in advertising
 01h 07mBig_Data_Meets_Digital_Advertising
 58mBig Data Analytics with Excel 2013
 27mTales at Scale: Analytics at 1000 QPS and Beyond
 47mAnalytics at the speed of Direct Lake
 28mData Reporting and Analytics with API's
 34mData Engineering Architecture