Big_Data_Meets_Digital_Advertising
summary
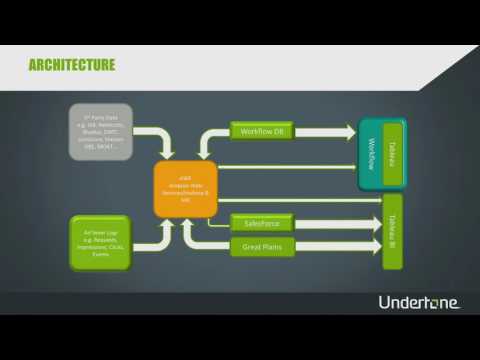
Ad network moves backend to AWS, processes logs with Hadoop/Pig/MapReduce and stores aggregates in Redshift views, then layers Tableau (benefiting from Tableau 9 parallel queries) to replace Excel chaos. 300 users access near-real-time dashboards: campaign pacing dashboard highlights days remaining vs projected shortfall so client services stop manually yellow-highlighting reports; fraud detection dashboard reduces suspicious-impression triage from ~90–120s loads to ~10–30s. Result: ~40% faster overall queries, a month to generate a billion records still, and analysts freed from 1–1.5 hours/day of tedious Excel work.
AI-written summary · about
chapters (15)
- 0:00Introduction to talk
- 1:06What is digital advertising
- 3:35Fraud and cross-screen delivery
- 6:07Why change to Tableau
- 8:12Big data infrastructure shift
- 11:00Initial struggles with Tableau
- 12:45Starting with Workflow reports
- 16:20Partnering with Slalom
- 18:47Tableau best practices
- 22:46Success with Slalom
- 23:31Before and after dashboards
- 31:46Fraud detection dashboard
- 36:07Campaign performance demo
- 41:56Lessons learned and impact
- 43:01Q&A session
related talks
 19mInsights for Everyone - Democratising Analytics
 30mData @Scale Seattle- Pawel Terlecki
 14mCross-Cloud Campaign Analytics Meets JavaScript
 12mScale analytics faster with Tableau Cloud (PRT034)
 01h 13mDriving business with autonomous analytics and data democratization
 30mAn architecture for big data: Supporting journalism through transparency in advertising
 11mBreaking Data Silos: Enterprise Data Management
 27mDashboards Are Dead: How To Democratise Data With Live Analytics (with fault)