Tracing for Granularity

summary
Go 1.11 adds an execution tracer that lets code mark regions and tasks so runtime events (scheduling, GC, syscalls, network) are attributed to application sections, and the net/http trace handler plus go tool trace visualizes the results. A demo records 312 tasks with a few ~100 ms outliers and shows GC and scheduler pauses (examples: 6–8 µs network, 5 µs blocking, 8 µs GC) causing latency. Limitations: regions must start and end on the same goroutine and the export format doesn’t map to common distributed-tracing formats.
AI-written summary · about
chapters (22)
- 0:00Introduction
- 0:36What is tracing
- 3:26Availability
- 5:59Trace Visualization
- 7:26Distributed Traces
- 8:46Latency
- 9:42Go
- 10:38Latency metrics
- 11:10No easy way
- 11:43Go execution tracer
- 13:27Execution tracer
- 14:45Execution flow
- 16:00New concepts
- 16:45Marking
- 17:15Regions
- 18:56Collecting data
- 19:20Web UI
- 20:48Task Regions
- 21:22Outlier Regions
- 22:24UI Changes
- 23:24Execution tracer tasks
- 23:58Limitations
related talks
 25mTracing Go
 30mMastering Distributed Tracing with Go
 22mDistributed Tracing
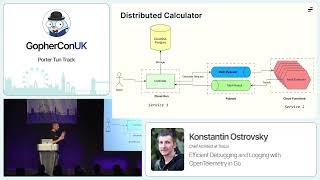 39mEfficient Debugging and Logging with OpenTelemetry in Go
 44mGo Profiling and Observability from Scratch
 51mNavigating Distributed Traces
 11mFinding out what's really going on, with DTrace!
 42mObservable Applications Using OpenTelemetry