A Debuggers Guide to Apache Flink Streaming Applications

summary
Step-by-step checklist for debugging Flink streaming: use metrics (failed checkpoints, consumer lag, throughput, checkpoint duration/size, barrier alignment time) to distinguish correctness vs capacity limits; inspect the job graph backpressure coloring introduced in Flink 1.13 UI backpressure coloring and per-subtask backpressure to spot data skew; examine checkpoint phases (synchronous, asynchronous, alignment) and mitigate with unaligned checkpoints, increase rocksdb writer/upload threads (rocksdb snapshot threads default 2; upload threads were 1 pre-1.12 and raised to 4 in 1.14), raise incremental checkpoint chunk threshold, or scale IOPS/compute; handle skew via composite keys or multi-stage map-reduce; profile locally first and use flame graphs in UI (sampling behind a feature flag) to find hot and blocking paths.
AI-written summary · about
chapters (8)
- 0:00Introduction to debugging Flink
- 1:31Performance issues in streaming apps
- 2:35Monitoring Flink applications
- 7:51Backpressure in Flink
- 11:50Checkpointing deep dive
- 19:57Profiling Flink applications
- 26:00Flame graphs in Flink UI
- 28:12Advanced debugging techniques
related talks
 34mTesting Production Streaming Applications
 36mFlinkspector: Taming the squirrel
 16mFlink acceptance testing and state compatibility checking
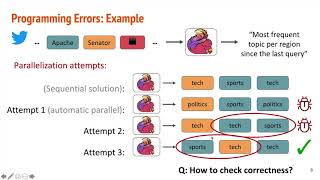 16mDiffStream: Differential Output Testing for Stream Processing Programs
 40mPerformance Testing and Big Data
 46mBlink and You’ll Miss It: Stories From Discovering Most Annoying Bugs and Test Flakes
 45mValidating Big Data Jobs - Stopping Failures before Production
 40mValidating Big Data Pipelines & ML (w Spark & Beam)