Linux Kernel Debug And Profiling Tools
summary
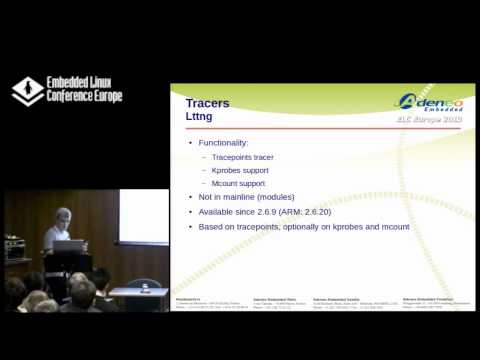
Overview of kernel debugging and profiling tools with concrete tradeoffs and examples: printk and debugfs for simple logs; tracepoints near-zero overhead when not enabled and expose ring-buffer events; kprobes/caprobes modify binaries at runtime and kprobes need debug symbols and can impose high overhead when active; ftrace supports function timing and ftrace supports early-boot tracing via kernel command line; perf samples hardware PMU counters for cache misses/cycles; lttng, systemtap and kgdb compile or register probes into modules and work for live or postmortem analysis.
AI-written summary · about
chapters (21)
- 0:00Introduction
- 1:31Definitions
- 3:03Kernel Features printk
- 4:53Kernel Features DebugFS
- 6:36Kernel Features Dynamic Debug
- 8:59Kernel Features Probes
- 11:27Kernel Features Static probes
- 15:09Kernel Features Tracepoints
- 17:39Kernel Features Trace events
- 19:43Kernel Features Dynamic probes
- 21:41Kernel Features Kprobes
- 22:35Kernel Features Perf events
- 25:35Tracers Ftrace (Function Tracer)
- 30:06Tracers Trace-cmd & Kernelshark
- 32:58Debuggers KGDB
- 35:37Debuggers KGTP
- 36:15Profilers Perf
- 43:36Miscellaneous SystemTap
- 46:19Miscellaneous System Tap
- 48:10Questions & Answers
- 49:58Miscellaneous Kexec & Crash
related talks
 31mFantastic tracepoints and where to find them
 52mLinux Kernel Debugging: Going Beyond Printk Messages
 35mLinux Tracing updates
 01h 29mModern Linux C++ Debugging Tools - Under the Covers
 41mLinux Tracing Techniques
 36mDebugging with eBPF on Arm Platforms
 58m“Debugging Linux C++”
 38mLinux Kernel Tracing Using eBPF