Observability in micro-service architectures

summary
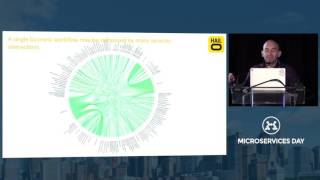
Services run on three continents with Go microservices; high-volume requests get traced by emitting JSON events into NSQ or, when latency bites, into a local UDP localhost client binary. Tracing uses a buffer of 200 messages with a select-default that drops excess — explicit tradeoff: prefer a working system over perfect instrumentation. Events get reassembled into web sequence diagrams and aggregated with go-metrics (1‑, 5‑, 15‑minute rates) so failures and latencies surface.
AI-written summary · about
related talks
 33mEffective observability in microservice architectures
 16mThe State of Observability
 39mEfficient Debugging and Logging with OpenTelemetry in Go
 20mKeynote: Service Meshes and Observability
 35mMonitoring Microservices
 31mUnderstanding Microservices with Distributed Tracing
 40mInstrumenting GO Applications
 28mMicroservices – Boyan Dimitrov