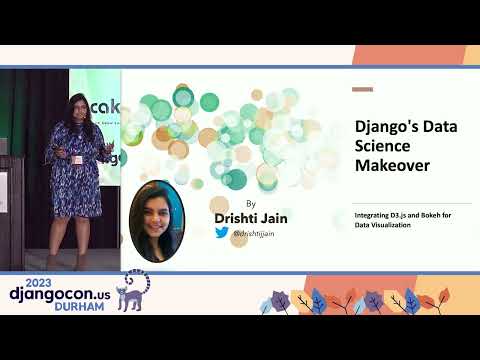
Django's Data Science Makeover: Integrating D3.js and Bokeh for Data Visualization
summary
Claims that Django serves interactive visualizations by embedding D3.js and Bokeh, shows a working scatter/contour demo built from the iris CSV with custom SVG shapes and color scales, and demonstrates real‑time streams via Django Channels (pip install channels, ASGI config, consumers.py, routing). Examples include precomputing statistics and returning JSON dumps with insights, how to include D3.js via script tag and add Bokeh JS and CSS, and notes deployment to an ASGI server.
AI-written summary · about
chapters (7)
- 0:00Introduction
- 3:54D3.js for custom visualizations
- 8:07Bokeh for interactive visuals
- 11:40Real-time data with Django Channels
- 14:52Building Channels app step by step
- 19:26ML models with Django visuals
- 22:15Summary
related talks
 02h 14mData Applications with Bokeh
 01h 55mInteractive Data Visualizations with Python
 26mDeveloping Dashboard Applications using Bokeh
 39mGetting started with Bokeh / Let's build an interactive data visualization for the web..in Python!
 01h 31mBokeh for Data Applications and Visualization
 59mBig data beautiful visualization on the browser with Bokeh
 45mDeveloping Dashboard Applications Using Bokeh
 01h 46mGetting Started With Bokeh