Om nom nom nom
summary
Prototype dashboard shows weekly GitHub code‑frequency and per‑contributor stats as a working demo built with Om + D3/Dimple and server push via Sente websocket channels. Global app state lives in a single atom with cursors and reference cursors to avoid re‑render storms; core.async channels (with buffering and untapping) distribute hover/click timestamps. Uses om/transact and om/update (not raw swap), redraws SVG on resize, and the demo repo pumpkin on GitHub contains the code.
AI-written summary · about
chapters (20)
- 0:00Start
- 1:25Dashboard
- 2:18Why build your own?
- 3:42Tables & Charts
- 4:22Don't visualise!
- 5:22Avoid pie charts
- 6:233D - why??
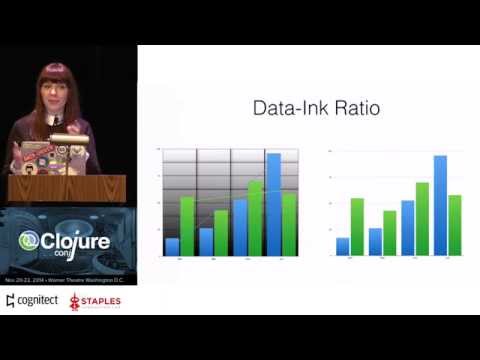
- 6:47Data-Ink Ratio
- 7:51Facebook's React
- 11:40Global state
- 14:20Local & shared state
- 15:23Components Widgets
- 17:26How fresh is fresh data?
- 18:09WebSockets / Long polling
- 21:18Dev setup
- 21:53Communication between server and client
- 28:34dimple chart
- 30:04stacked bar chart
- 30:47That's all folks!
- 32:26Useful links


